
Note
Go to the end to download the full example code.
Map tile acquisition#
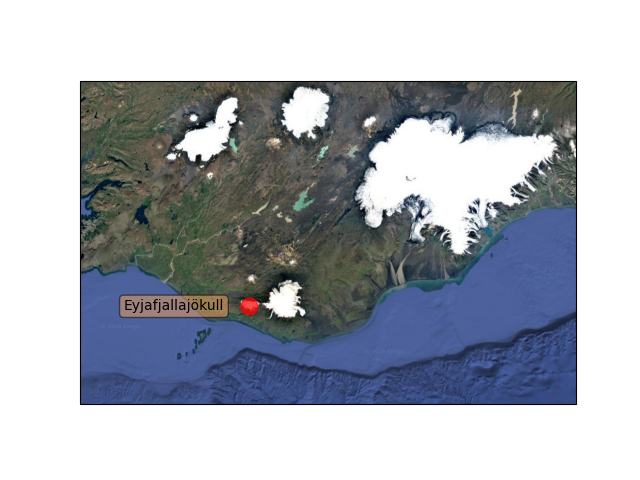
Demonstrates cartopy’s ability to draw map tiles which are downloaded on demand from the Google tile server. Internally these tiles are then combined into a single image and displayed in the cartopy GeoAxes.
import matplotlib.pyplot as plt

import cartopy.crs as ccrs
import cartopy.io.img_tiles as cimgt


def main():
    # Create a background image tile.
    google_terrain = cimgt.GoogleTiles(style="satellite")

    fig = plt.figure()

    # Create a GeoAxes in the tile's projection.
    ax = fig.add_subplot(1, 1, 1, projection=google_terrain.crs)

    # Limit the extent of the map to a small longitude/latitude range.
    ax.set_extent([-22, -15, 63, 65], crs=ccrs.Geodetic())

    # Add the tile data at zoom level 8.
    ax.add_image(google_terrain, 8)

    # Add a marker for the Eyjafjallajökull volcano.
    ax.plot(-19.613333, 63.62, marker='o', color='red', markersize=12,
            alpha=0.7, transform=ccrs.Geodetic())

    # Add text 25 pixels to the left of the volcano.
    ax.annotate('Eyjafjallajökull', xy=(-19.613333, 63.62), transform=ccrs.Geodetic(),
                xytext=(-25, 0), textcoords='offset pixels',
                verticalalignment='center', horizontalalignment='right',
                bbox=dict(facecolor='sandybrown', alpha=0.5, boxstyle='round'))
    plt.show()


if __name__ == '__main__':
    main()
Total running time of the script: (0 minutes 0.279 seconds)