Ctrl+K
You are viewing the latest unreleased documentation 0.25.1.dev120+ge2b775d75. You can switch to a stable version.
cartopy 0.25.1.dev120+ge2b775d75 documentation - Home cartopy 0.25.1.dev120+ge2b775d75 documentation - Home
  • Getting started
  • Gallery
  • Installation
  • API reference
  • What’s new
  • GitHub
  • Getting started
  • Gallery
  • Installation
  • API reference
  • What’s new
  • GitHub

Section Navigation

  • Lines and polygons
    • Custom Boundary Shape
    • Feature Creation
    • Features
    • Global Map
    • Hurricane Katrina
    • Nightshade feature
    • Ocean bathymetry
    • Rotated pole boxes
    • The effect of badly referencing an ellipse
    • Tissot’s Indicatrix
  • Scalar data
    • Adding a cyclic point to help with wrapping of global data
    • Choropleth map: associating data with geometries
    • Contour labels
    • Contour transform options
    • Filled contours
    • Map tile acquisition
    • Plotting the Aurora Forecast from NOAA on Orthographic Polar Projection
    • Raster reprojections
    • Reprojecting images from a Geostationary projection
  • Vector data
    • Arrows
    • Barbs
    • Regridding vectors with quiver
    • Streamplot
  • Web services
    • Displaying WMTS tiled map data on an arbitrary projection
    • Interactive WMS (Web Map Service)
    • Interactive WMTS (Web Map Tile Service)
    • Web Map Tile Service time dimension demonstration
    • Web tile imagery
  • Gridlines and labels
    • Aligning Cartopy and Matplotlib axes
    • Gridlines and tick labels
    • Tick Labels
  • Miscellanea
    • Animating a gridded surface
    • Cartopy Favicon
    • Cartopy Logo
    • Displaying all 60 zones of the UTM projection
    • Displaying data on an eccentric ellipse
    • Modifying the boundary/neatline of a map in cartopy
    • Recreation of the Monorail Map from The Simpsons
    • Tube Stations
    • UN Flag
    • Using Cartopy and AxesGrid toolkit
  • Gallery
  • Gridlines and labels

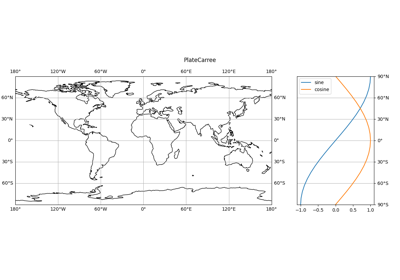
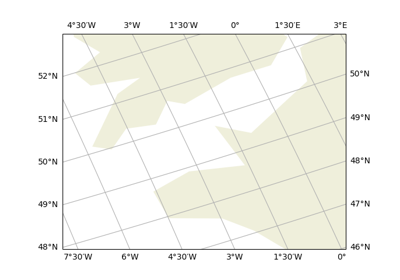
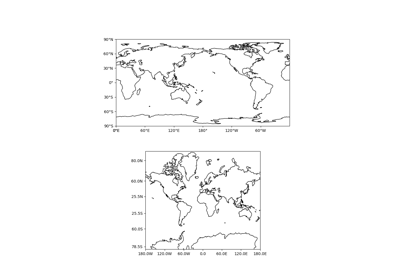
Gridlines and labels#

Aligning Cartopy and Matplotlib axes

Aligning Cartopy and Matplotlib axes

Gridlines and tick labels

Gridlines and tick labels

Tick Labels

Tick Labels

previous

Web tile imagery

next

Aligning Cartopy and Matplotlib axes

Show Source

© Copyright 2011 - 2018 British Crown Copyright, 2018 - 2026 Cartopy contributors.

Created using Sphinx 9.1.0.

Built with the PyData Sphinx Theme 0.17.1.