
Note
Go to the end to download the full example code.
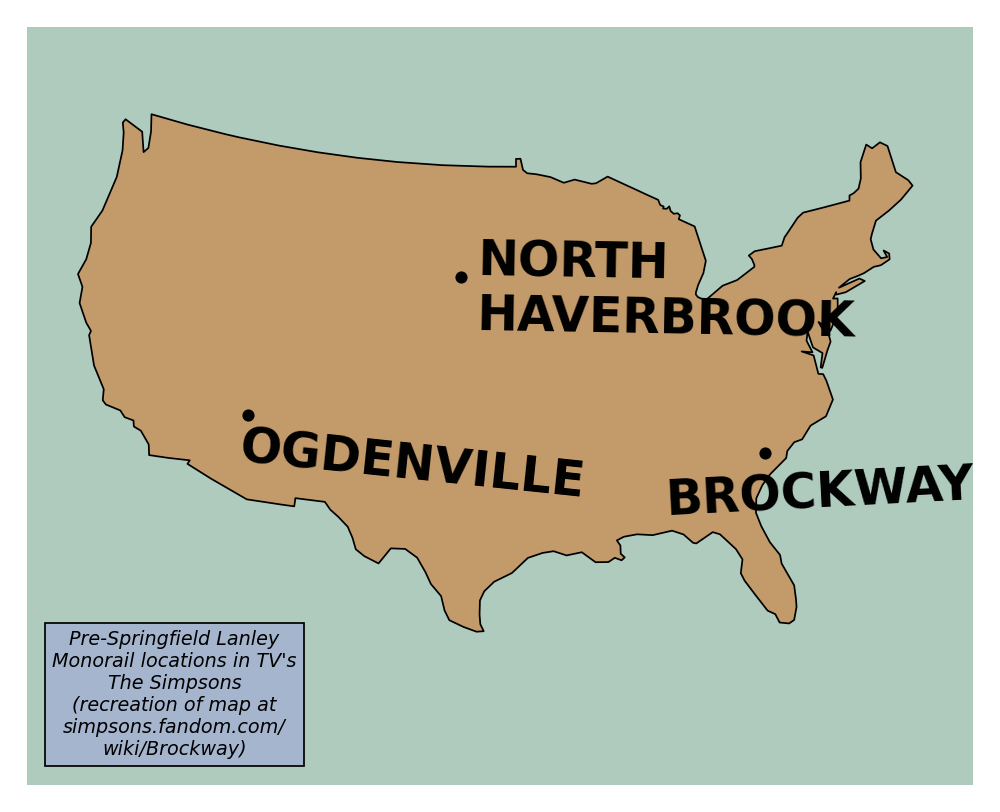
Recreation of the Monorail Map from The Simpsons#
This example demonstrates how to create a minimal outline map of a defined area of land such as a continent, with optional labels at specified locations within the region, in the form of a recreation of the Monorail Map from The Simpsons with humorously oversized labelling (to imitate handwriting/scribbles) and sparsity of marked locations (which are all fictional).
Specifically, it aims to recreate to best likeness using Cartopy the map of pre-Springfield Lyle Lanley Monorail locations from the iconic episode ‘Marge vs. the Monorail’ (1993) of the TV Series, as taken in likeness from the screen grab available at: https://simpsons.fandom.com/wiki/Brockway.
import matplotlib.pyplot as plt

import cartopy.crs as ccrs
import cartopy.io.shapereader as shpreader


# Define choices for projection and locations to plot
GEOM_PROJ = ccrs.PlateCarree()
# Not real places, so locations pulled from location on map in still image.
# The items in order correspond to:
# * an x-y 2-tuple for where to plot the location dot on the map;
# * an x-y 2-tuple for where to write the text label relative to the dot above
#   with units of points;
# * an integer for how much to rotate the text to best match the map text.
LOCATIONS_TO_PLOT = {
    "Ogdenville": [(-111.8, 35.5), (-10.0, -50.0), -6],
    "North\nHaverbrook": [(-99.0, 43.5), (15.0, -15.0), -1],
    "Brockway": [(-80.4, 33.6), (-100.0, -40.0), 3],
}


def main():
    # Set up a plot with a light blue background and a white overall border.
    # For proportions of land mass, font size and border to be as
    # intended, need to keep 'figsize' and 'dpi' (4:3 ratio) as below.
    fig = plt.figure(
        figsize=(8., 6.5),
        dpi=125,
        facecolor="#AFCBBD",
        edgecolor="white",  # sets up white border without need for another axes
        linewidth=30,  # makes the border thicker as per original map
    )
    map_ax = fig.add_axes(
        [0.035, 0.035, 0.93, 0.93], projection=ccrs.LambertConformal(), frameon=False
    )

    # Center on location of USA with a bit of space on all sides to pad
    map_ax.set_extent([-120, -72.5, 20, 50], crs=ccrs.Geodetic())

    # Plot only the USA landmass, in a fawn colour with a thin black border
    shpfilename = shpreader.natural_earth(
        resolution="110m", category="cultural", name="admin_0_countries"
    )
    countries = shpreader.Reader(shpfilename).records()
    usa_border = [
        country.geometry
        for country in countries
        if (country.attributes["NAME"] == "United States of America")
    ]
    map_ax.add_geometries(
        usa_border,
        GEOM_PROJ,
        facecolor="#C39B6A",
        edgecolor="black",
    )

    # Now add the location labels one by one
    for loc_name, loc_details in LOCATIONS_TO_PLOT.items():
        loc_coords, rel_text_pos, text_rot = loc_details
        map_ax.plot(
            *loc_coords,
            marker="o",
            color="black",
            markersize=6,
            transform=GEOM_PROJ,
        )

        # Text in uppercase, very bold handwriting-like font, as per the
        # screen grab of the map from the show
        map_ax.annotate(
            loc_name.upper(),
            xy=loc_coords,
            transform=ccrs.Geodetic(),
            xytext=rel_text_pos,  # shift text relative to marker as in map
            textcoords="offset pixels",
            verticalalignment="center",
            horizontalalignment="left",
            fontname="Charcoal",  # ensure you have this font available
            fontweight="black",
            fontsize=28,
            rotation=text_rot,  # slightly wonky text for handwritten effect
        )

    leg_text = (
        "Pre-Springfield Lanley\nMonorail locations in TV's\nThe Simpsons\n"
        "(recreation of map at\nsimpsons.fandom.com/\nwiki/Brockway)"
    )

    # Add the bottom left 'compass' legend in spirit of the original map.
    map_ax.text(
        0.15,
        0.02,
        leg_text,
        transform=map_ax.transAxes,
        fontsize=11,
        horizontalalignment="center",
        verticalalignment="center",
        style="italic",
        bbox=dict(facecolor="#A5B5CE"),
    )

    plt.show()


if __name__ == "__main__":
    main()
Total running time of the script: (0 minutes 0.222 seconds)